

Here is the uncomfortable part, and it is about me.
In September I published a write up of 197 online stores I had reviewed by hand. I told you site speed was almost the rarest problem in the sample, named in 8 of 197 notes. I also told you the stores were mostly fine on speed.
The first half of that holds. The second half does not. This week I measured it properly, and about half of the stores I could measure fail Google’s own speed check on mobile.
I am telling you this before anything else, because the way I was wrong is the most useful thing I can give you on this subject. It is also the reason I think most of the money store owners spend on speed goes to the wrong place.
What I did this week
My September notes came from reading page source. That tells you how heavy a page is. It does not tell you how fast the page feels to a real person on a real phone.
Google does collect that. Chrome users who allow it send back anonymous timings, and Google publishes them per site in the Chrome UX Report. It is the same data behind the Core Web Vitals report in Search Console and the top section of PageSpeed Insights.
On 16 October I looked up that real visitor data for 50 stores from the 197.
The 10 whose notes said anything about speed
40 more, picked at random from the other 187
For each one I took the homepage, on mobile, over the latest 28 days.
Google’s check has three parts, and a page passes only when all three are good for at least three visits in four.
Loading. The main content should appear within 2.5 seconds (Largest Contentful Paint)
Responsiveness. A tap should get a visible reaction within 0.2 seconds (Interaction to Next Paint)
Stability. Things should not jump around while the page loads (Cumulative Layout Shift, which should stay under 0.1)
What I found
Thirteen of the 50 gave me nothing. Twelve had too few Chrome visitors for Google to publish any data, and one would not load in the test. That is a finding in its own right, and I come back to it below.
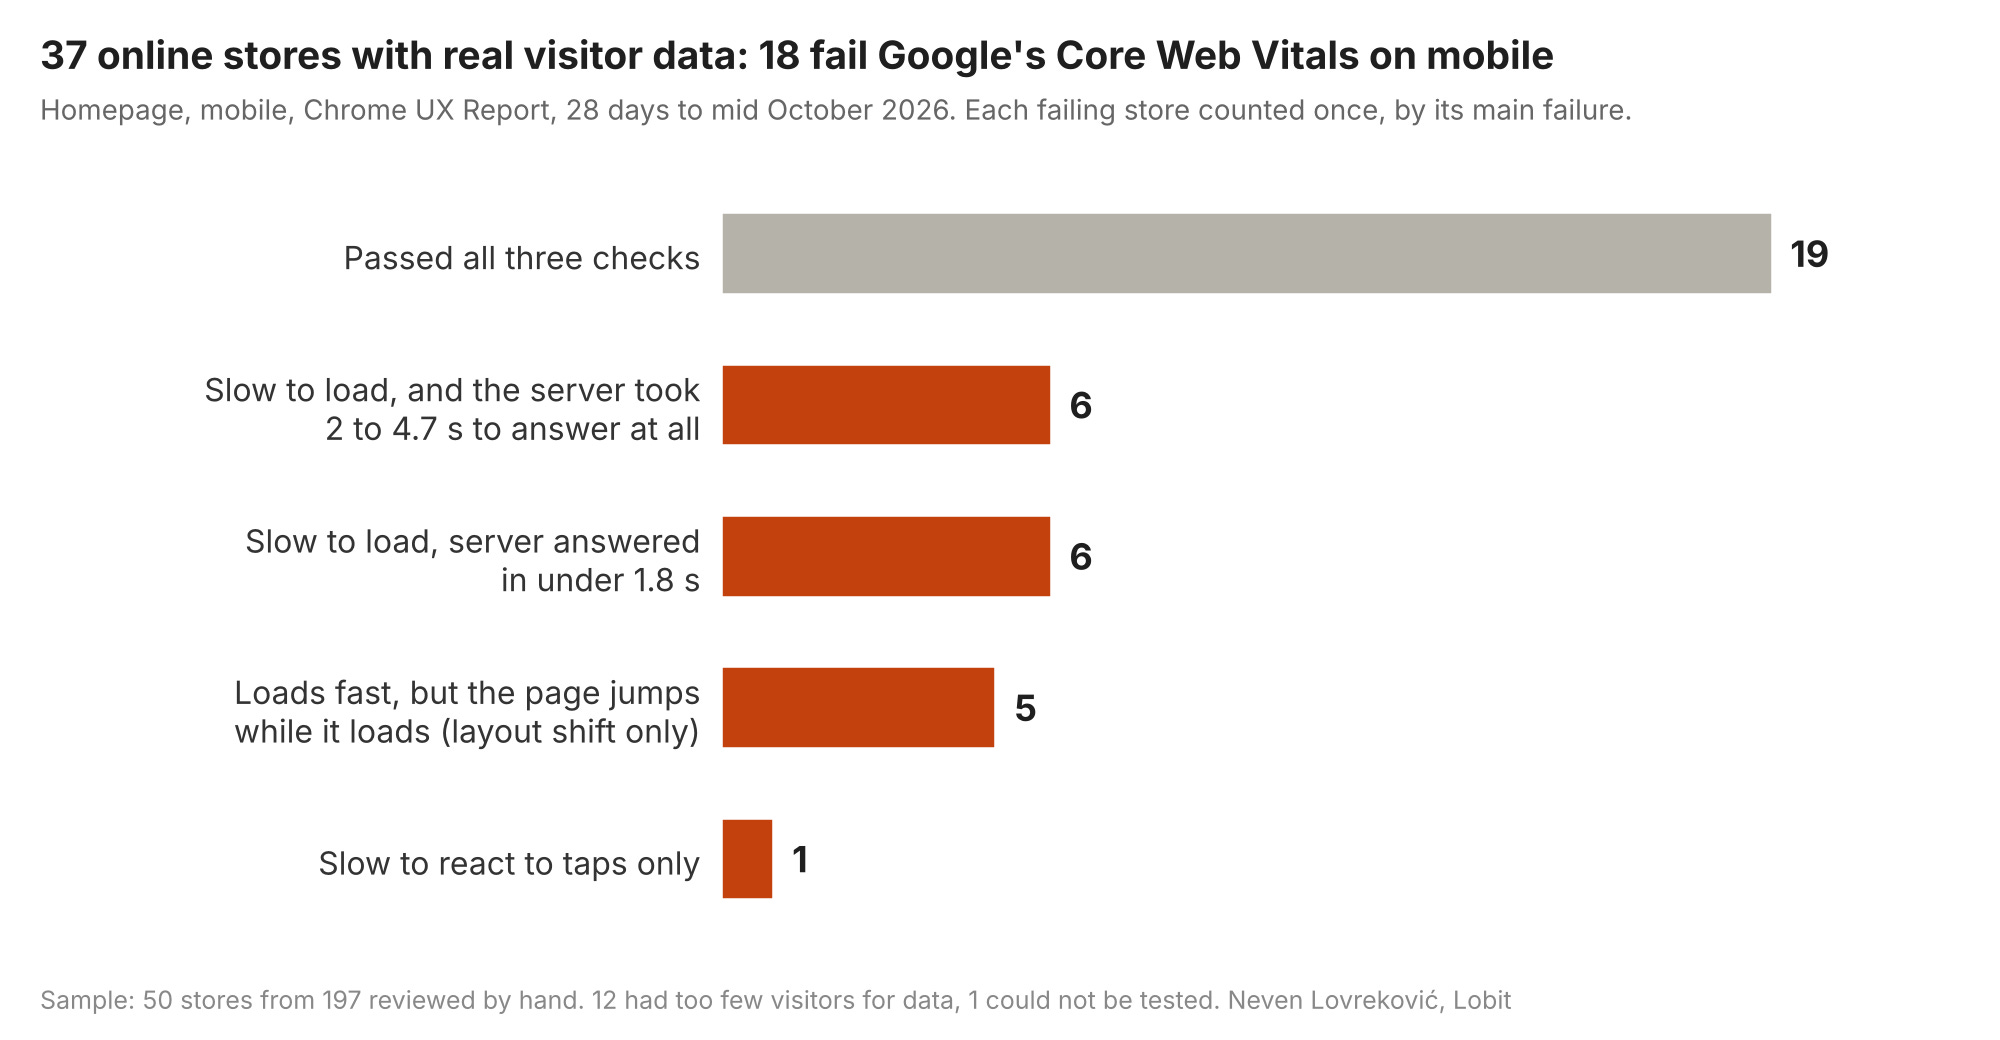
Of the 37 stores with data, 18 failed and 19 passed.
Now the part that stung. Of the 10 stores my notes had flagged as slow, two had no data, four failed and four passed. One I had written off because its platform was so old it surely had terrible numbers. It passed comfortably.
Among the 40 stores nobody had flagged, 14 of the 29 with data failed.
My notes picked slow stores no better than a coin toss.
So “8 of 197” was a true count of what I wrote down, and a bad estimate of the world. Reading source code is not measuring speed. I should have said that in September, and I am saying it now.
Why most speed fixes miss
This is where the title comes from. Look at why the 18 stores failed.
Six were slow before anything had started. Their servers took between 2 and 4.7 seconds just to begin answering. Google treats anything over 1.8 seconds as poor for this step. No image compression, lazy loading or speed plugin touches that number, because the delay happens before the browser has received a single image. The fix lives in hosting, caching, or what the platform does on every request.
Six were slow to load, with a server that answered in under 1.8 seconds. These are the stores the usual advice actually fits. A huge first image, heavy fonts, a slider, and apps and tracking scripts that hold the page back.
Five loaded fast and failed anyway, because the page jumped while it loaded. A promotional bar appearing above the products, images with no space reserved for them, a cookie banner pushing everything down. That is usually an afternoon of a developer’s time. Almost nobody sells it as a speed project, because the score most people look at barely moves when you fix it.
One failed only on reacting to taps. That is usually too much script, often from third party apps.
Twelve of the eighteen failing stores had a problem that the standard pitch would not have fixed. Compress the images, install a plugin, chase the score to 90. None of that reaches a slow server or a jumping page.
That is the waste. Not speed itself. Paying to fix the wrong part of it.
Where September still stands
Passing these checks does not make you rank. Google has said for years that a good page experience does not outweigh having the most relevant page. A store that fails is losing some buyers to frustration, and perhaps a little ground in close rankings. A store with a broken title on every category page or forty copies of each category URL is not even in the running.
So the order I gave you in September stands, and so does the way to choose what is worth fixing first. Speed is still not your most expensive problem. It is simply more common than I told you, and more often misdiagnosed.
The ten minute check
Step 1. Run your homepage. Open pagespeed.web.dev and enter your homepage address.
Step 2. Ignore the big round score. That number lower down is a lab simulation on one imagined phone. Read only the top section, the one headed “Discover what your real users are experiencing”.
Step 3. If it says Passed, stop. Do not buy a speed project this quarter. Spend the money on whatever your real problem is.
Step 4. If it says Failed, find which part is red, then look at Time to First Byte under “other notable metrics”. Read your result this way.
Time to First Byte over 1.8 seconds. Talk to your host or developer about server response and caching first. Image work will not help yet
Loading red, Time to First Byte fine. Now image size, fonts, sliders and scripts are the right conversation
Only stability red. Ask a developer to reserve space for images and banners and to stop bars pushing content down. A small job
Only responsiveness red. List every app and third party script on the site and remove the ones nobody uses
Step 5. Repeat on your best selling category page and product page. Your homepage is not where most buyers land.
If the top section says No Data, you are where 12 of my 50 were. Google does not have enough Chrome visits to publish your numbers. Open your store on your own phone, on mobile data with wifi off. If it is readable within a couple of seconds and nothing jumps, move on to your real problems.
Before you sign a speed quote
Ask three questions.
Which of the three checks am I failing in real visitor data, not in the lab score?
What is my Time to First Byte, and does your work change it?
How will we know in 28 days whether it worked? The real visitor data rolls over a 28 day window, so that is the earliest honest answer.
If the answers come back as a lab score, you have learned what you are paying for.
What I would not conclude
This is 50 stores, homepage only, mobile only, looked up on one day. It is not a rate for your market
The stores are small and mid sized shops in the UK, Australia and New Zealand, most of them in New Zealand
I did not measure revenue. I am not telling you what a failing score costs in money, because I do not know
The groups above are mine. Each failing store is counted once, by its main failure, and three of the slow loading stores also jumped while loading
One sample, honestly labelled, beats a sample of size one. It does not beat yours. Run the check.
If you would rather not read the report yourself, I will.
Send me your store and I will tell you which of the three checks you fail, which kind of fix it needs, and whether it is worth doing before anything else on your list. Free, in writing, no call.
If you run the check yourself, reply and tell me what the top section said. Passed, Failed and which part, or No Data. I read every reply, and if the pattern across replies is interesting, it becomes a post.
Next week, four weeks before Black Friday, what you can still fix in time and what you should leave alone.
Neven Lovreković
Ecommerce SEO strategist
neven-lovrekovic.com · LinkedIn
P.S. In September I told you to check whether a problem is yours before you pay somebody to solve it. This week I took my own advice and found I had been answering from the wrong data. Ten minutes on pagespeed.web.dev, before the next invoice.