
How to Find the Five Store Pages Worth Fixing First
Search Console can show you which pages are leaving the most clicks on the table. Here is how to put a number on the gap before you spend a Saturday fixing the wrong one.

The most expensive thing in small store SEO is often not the mistake you never fixed.
It is the twenty hours you spent fixing something that was never going to move.
I see the same sequence every few weeks. A store owner runs a crawler, gets a report with fourteen hundred issues, sorts by severity and starts working through the red section.
Three weekends later the site is technically cleaner and the traffic looks exactly the same.
The problem was not necessarily the fixes.
The problem was the order.
Severity does not tell you what a fix is worth
A crawler severity score tells you how serious an issue may be technically. On its own, it cannot tell you how much traffic or revenue fixing that issue is likely to return.
Those are different questions.
Take missing meta descriptions.
A crawler might find three hundred product pages without one and mark all of them the same way.
But imagine that two hundred and eighty of those pages received almost no Google impressions during the last three months.
The remaining twenty are already being shown thousands of times.
Writing three hundred descriptions treats those pages as equally valuable.
They are not.
This post is about finding the few that deserve your attention first.
When I would ignore this method and fix everything
There are cases where prioritising individual pages makes little sense.
If the site has twenty products, you can probably fix the whole catalogue faster than you can build a scoring system for it.
A sitewide indexing setting, broken canonical template or technical error affecting every product is also different. Fix the root cause immediately.
A migration deserves the same treatment. During a replatform you are protecting URLs, content and existing visibility. That is risk management, not opportunity scoring.
For a normal established store with hundreds or thousands of URLs, I would rather know which ten pages matter than have another export containing every problem the site has.
What I keep finding in online stores
I manually reviewed 197 small and mid sized online stores across the UK, Ireland, the United States, Canada, Australia and New Zealand.
This was screening rather than client work.
I deliberately recorded only the biggest visible issue in each store. That means the dataset cannot tell me how many smaller problems each store had, and I do not use it that way.
What it did show me repeatedly was how concentrated the biggest opportunities could be.
A store might have hundreds of indexable URLs while a small group of category pages, guides or products accounts for most of the useful search exposure.
That is the pattern behind this post.
You do not need to start with every page Google knows about.
You need to start with the pages Google already gives a chance.
Change the question
Instead of asking:
What is broken on my store?
Ask:
What is happening on pages Google already shows to people?
That wording changes the job.
A page that already receives impressions gives you evidence to work with. You know Google understands something about it. You know queries exist. You know people are seeing the result.
Now you can ask whether the page is earning what that visibility should be worth.
Low impression pages still matter. They simply belong to a different investigation.
I should also be straightforward about my interest here. Deciding where a store’s SEO effort goes is one of the things people pay me for, and there is an offer at the end of this post.
The method below is the same kind of prioritisation I use.
You can run the first version yourself this afternoon.
Start with one free report
Open Google Search Console.
Go to Performance and set the date range to the last three months.
Turn on:
Clicks
Impressions
Average CTR
Average position
Then open the Pages tab and sort by impressions, highest first.
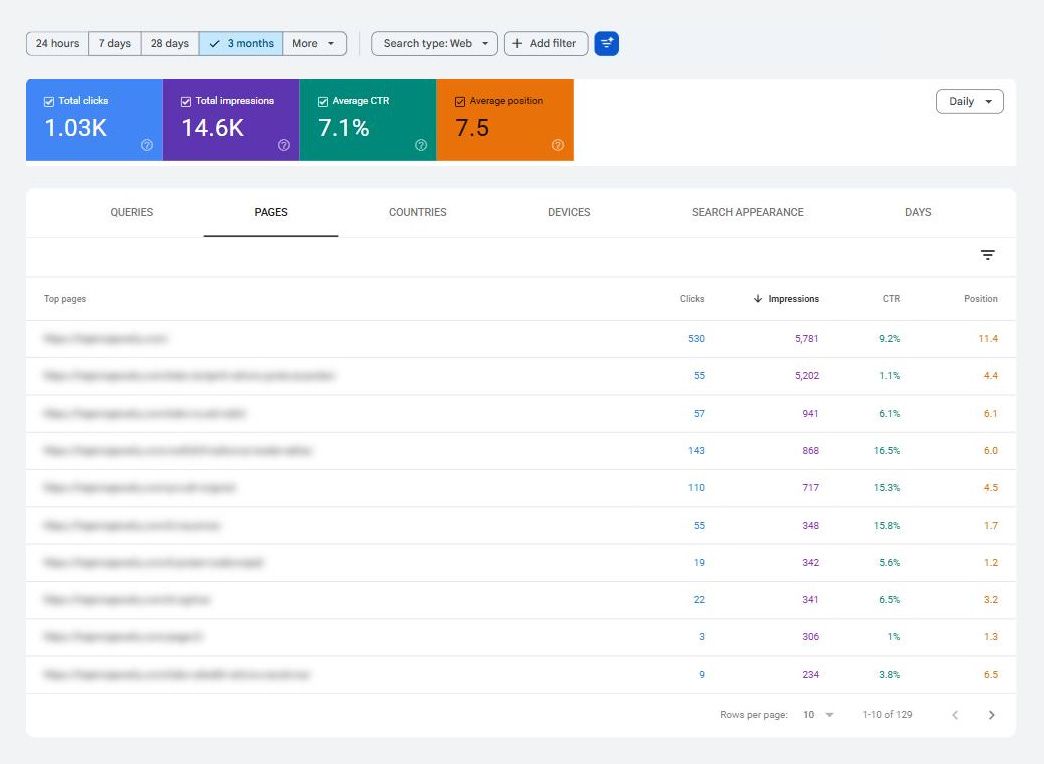
Caption: One report, sorted one way. Store URLs blurred on purpose.
The first thing this gives you is a shortlist.
That distinction matters.
The Pages report tells you where to investigate.
It does not always tell you what to change.
A single page can rank for dozens or hundreds of queries. One query might sit at position three, another at eleven and another at thirty. Some traffic may be branded. Some may come from one country. Mobile and desktop can behave differently.
The page average compresses all of that into one row.
So do not rewrite anything yet.
Pages gives you the shortlist. Queries gives you the diagnosis.
Start with a high impression page that looks interesting.
Click the URL in Search Console so the report filters to that page.
Now switch to Queries.
This is the part I would not skip.
Look at where the impressions actually come from.
If most of them are caused by people searching your store name, the page level CTR can look far healthier than your non branded performance really is.
Filter branded searches out where possible. If your Search Console property has the branded and non branded filter available, use it. Otherwise exclude the obvious variations manually.
Then look at the queries producing most of the remaining impressions.
You are trying to understand whether one problem actually exists.
A page can have a weak overall CTR because it ranks poorly for most queries.
That is not automatically a title problem.
Another page can sit near the top for important queries and still attract almost no clicks.
That is much more interesting.
The signals I use
Once you have looked at both the page and its queries, the pattern usually falls into one of these buckets.
What you seeWhat I investigate nextStrong impressions, good rankings, weak CTRSearch result presentation, title, snippet, intent and SERP competitionStrong impressions, rankings just outside the strongest resultsContent relevance, internal links, authority and whether the page deserves to moveGood rankings and strong CTRLeave it alone unless there is another clear reason to change itVery low impressionsIndexing, demand, targeting, internal discovery or whether the page needs to exist
The point is not to force every page through the same fix.
The point is to identify the constraint before touching the page.
Turning a CTR opportunity into a number
For pages that appear to have a real click gap, I use a simple estimate.
Take the number of impressions.
Take the current CTR.
Then compare it with a rough CTR benchmark for the position where the important queries are actually sitting.
The calculation is:
Estimated additional clicks = impressions × expected CTR gap
For a quick external benchmark I use First Page Sage’s organic CTR curve.
Their current figures put position one at roughly 39.8 percent, position two at 18.7 percent and position three at 10.2 percent.
The curve then falls to about 7.2, 5.1, 4.4, 3.0, 2.1, 1.9 and 1.6 percent through position ten.
Do not treat those numbers as a promise.
They are a ruler.
Your store, industry, device mix, search intent and SERP layout can produce a very different curve.
I mainly use the benchmark to answer a simpler question.
Is this page obviously underperforming relative to the visibility it already has?
If the answer is yes, it moves up the list.
One warning matters much more in 2026
A normal organic position is no longer a normal organic position on every SERP.
Shopping results, image packs, videos, local results and AI answers can all sit above or around the standard links.
A page listed as position five in Search Console can therefore be appearing in very different environments.
Before treating a CTR benchmark seriously, search the important query yourself.
Look at what is actually between the user and your result.
If your Search Console property has the newer Generative AI performance reporting available, check that too. AI related impressions can change how you interpret the overall search numbers.
This is one reason I would never build an exact revenue forecast from a generic CTR curve.
The number is useful for prioritising.
It is not accounting.
Three real examples
The buying guide
The second row in the screenshot has 5,202 impressions over three months.
Average position is 4.4.
CTR is 1.1 percent.
That produced roughly 55 clicks.
A rough benchmark around that position would put expected CTR closer to five percent.
At 5.1 percent, 5,202 impressions would produce about 265 clicks.
The difference is around two hundred visits during the same period.
That does not prove a title rewrite will deliver two hundred extra visits.
It tells me the gap is large enough to investigate.
I would click into the page, inspect the queries, remove branded noise, check the live SERP and then decide whether the title and snippet are actually the constraint.
If they are, this page goes near the top of my list.
A crawler may never flag it because technically nothing is broken.
The page I would leave alone
Another row has 868 impressions, average position 6.0 and CTR of 16.5 percent.
The generic benchmark around position six is much lower.
Whatever is happening there, searchers clearly respond to the result.
Leave it alone.
I mean that literally.
There is a strange urge in SEO to improve everything once you notice it.
Sometimes the most profitable decision is not touching the thing that already works.
The page with eighteen thousand impressions
Another store had a page with roughly 18,000 impressions, CTR around 0.4 percent and average position 14.6.
At first glance it looks like an enormous CTR opportunity.
I would not start by rewriting the title.
I would open the Queries report first.
If the important terms are really sitting around page two, searchers are barely seeing that result in a useful position.
The low CTR is probably a symptom.
The bigger opportunity is getting the page high enough for the title to matter.
That is a different job.
Do not turn average position into a rule
I used to see people build workflows around ranges such as positions four to fifteen.
I would not do that.
A page at position two can still have a serious click problem.
A page around position twelve can sometimes have a strong snippet and simply need more ranking power.
The page average can also hide several completely different query situations.
Use position as evidence.
Do not turn it into a hard gate.
Four numbers that can mislead you
Brand searches can make weak pages look excellent
The first row in the screenshot is a good example.
The homepage reports a surprisingly strong CTR despite an average position that would normally suggest much less.
That does not automatically mean brilliant copy.
It can simply mean people are searching for the store by name.
Open Queries and remove brand terms before deciding the page is untouchable.
A three month total can hide one strange week
A page with 30,000 impressions might have earned almost all of them during one seasonal spike.
Look at the chart.
If the page had six quiet weeks and then one huge burst caused by Black Friday, Christmas, a product launch or a news event, the total is describing a very different opportunity from a page earning steady impressions every day.
SERP features change the meaning of position
If AI Overviews, shopping results or a video block sits above you, generic benchmark curves become much less useful.
Position five on one query can be highly visible.
Position five on another can feel halfway down the page.
Look at the SERP before believing the spreadsheet.
Average position is still an average
The page in the screenshot below reports an overall average position of 11.4.
Split it by country and the picture changes.
One market performs near the first page.
The United States is around 28.7.
The United Kingdom is around 31.6.
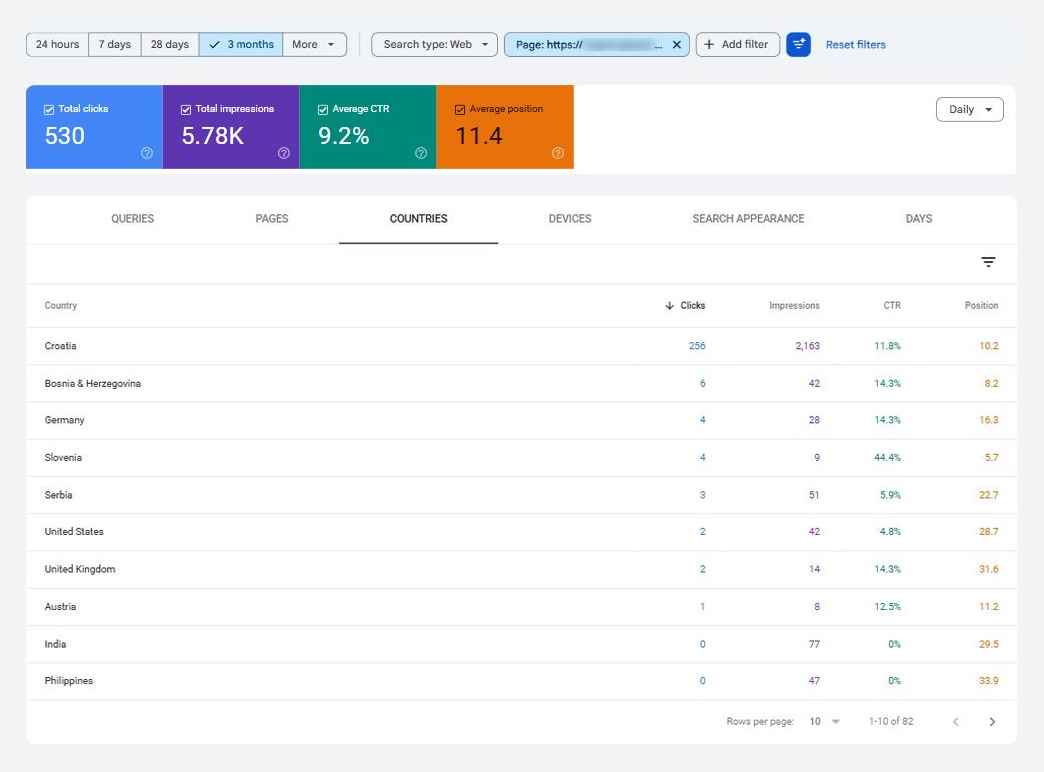
Caption: The same page, split by country. One average hiding several very different markets.
None of those individual markets behaves like the global average.
Before I make an important decision on a page serving several countries, I split the data.
Country is usually the first filter.
Device can matter too.
Add the money layer if the page is commercial
Traffic is useful.
Revenue is better.
If the page you are evaluating is a commercial page and you have reasonable conversion data, you can add one more estimate.
Estimated revenue opportunity = additional clicks × conversion rate × average order value
Imagine the click gap suggests around 200 additional visits.
If a comparable commercial page converts at 2.5 percent and your average order value is £80, the rough revenue opportunity would be:
200 × 0.025 × £80 = £400
I would never present that as a forecast.
It is a prioritisation estimate.
A buying guide, category page and product page can have completely different conversion behaviour.
Still, even a rough money estimate helps when two pages both look like good SEO opportunities and you need to choose which one gets Friday afternoon.
What happens to the other pages?
Nothing this month.
That is the part people resist.
They want a complete checklist because completeness feels safe.
I would rather have five pages with a reason behind each decision.
The rest stay in the queue.
You can set a simple impressions floor for the next review. Maybe one hundred impressions in ninety days for a small store. A larger site may need a much higher threshold.
Once a page crosses your floor, it becomes eligible for investigation.
Pages that never cross it need a different conversation.
Maybe Google does not understand them.
Maybe nobody searches for what they target.
Maybe they are buried internally.
Maybe the catalogue has twenty pages serving the same intent.
Sometimes the right question is whether that page deserves to exist at all.
How many pages should you change at once?
For a small store, I like five.
There is nothing mathematically special about the number.
It is simply small enough that you can track what happened and repeat the process without turning it into a six month project.
If you change forty titles at once and traffic rises, you learn very little.
Change five pages chosen for a clear reason and the result is easier to interpret.
What if every page has low impressions?
Then this method is not your starting point.
You probably have a visibility problem before you have a CTR problem.
That can mean indexing, weak demand, poor targeting, thin category coverage, internal linking or a site that simply has not built enough authority yet.
The fifteen minute check I published when I started this newsletter is a better place to begin.
Category pages or product pages?
In many stores, category pages become the more interesting candidates because search demand concentrates there.
One category can match a wider family of commercial searches while forty individual products split that demand between them.
That does not mean product pages are irrelevant.
It means I would let the impressions tell me where the opportunity already exists rather than deciding in advance which template deserves attention.
My audit tool already has priorities
Good.
Use them.
Just understand what the priority means.
A technical tool can tell you an issue is severe.
Some tools can also connect directly to Search Console and import performance metrics.
That still does not mean the default severity order equals business opportunity.
I want both views.
How serious is the issue?
And:
How much is happening on the affected pages?
When those lists disagree, that is where prioritisation becomes useful.
How long before you know whether a change worked?
I normally want at least four weeks.
Six is better when impression volume is low.
Google needs time to recrawl the page and you need enough new impressions for the comparison to mean something.
Before you make the change, save:
The URLs
The exact date range
The country and device filters
Whether branded searches were included
Impressions, clicks, CTR and position
Then make the change and stop touching the page.
The important part is being able to rebuild the same view later.
Measuring the result without lying to yourself
A month later, compare the same segment.
If CTR rises while rankings stay broadly similar, the search result change is the strongest explanation.
If CTR improves and position also moves significantly, the result is good but attribution becomes messier. A page that climbed from eight to four should have earned more clicks even if the title had never changed.
If nothing happens, check the live result.
Google may have rewritten the title.
The query mix may have changed.
A new SERP feature may have appeared.
Or the title was never the real constraint.
That last outcome is useful too.
You tested the cheapest explanation and ruled it out.
Now you know where not to spend another month.
What I would do this week
Open Search Console.
Use the last three months.
Sort Pages by impressions.
Find the pages with meaningful visibility and investigate their queries.
Remove brand noise where it distorts the picture.
Check the SERP.
Estimate the click gap only when the page really looks like a CTR opportunity.
Then keep the five pages where the upside looks largest and the explanation makes sense.
Save your baseline.
Make the changes.
Come back to the same view in four to six weeks.
That is one afternoon.
At the end of it you do not have a bigger SEO list.
You have a smaller one with evidence next to every line.
If you would rather have someone do the sorting, that is the part I do.
Send me your store and I will send back a short video walking through what I find, including which pages I would put in the first five and why.
It is free.
There is no call to book.
If I cannot find anything useful, I would rather tell you that than manufacture a pitch.
Not ready for that?
Stay on the list.
P.S. Do not just save the numbers. Save the view that produced them. Four weeks from now you will remember the URLs. You probably will not remember whether you had brand searches included, which country you were looking at or whether the page was being dragged around by one query. A baseline only helps if you can reproduce it.
Ecommerce SEO Strategist