

Two weeks ago I read a study on AI citation sources, left a comment under it, and made a public prediction about what the same measurement would look like in ecommerce.
Then I said I would test it instead of assuming the pattern carried over.
So I did.
Two of my predictions were wrong.
Before getting into the numbers, one thing is worth making clear. I sell SEO strategy, not an AI visibility tool, so I have no reason to make one engine look better than another. The sample is mine, the prompts are documented, and I have included the limitations at the end.
If you disagree with the conclusions, there should be enough here to challenge them properly.
What the benchmark said, and what I expected
The original study looked at where AI engines pull citations from when people ask SaaS-related questions.
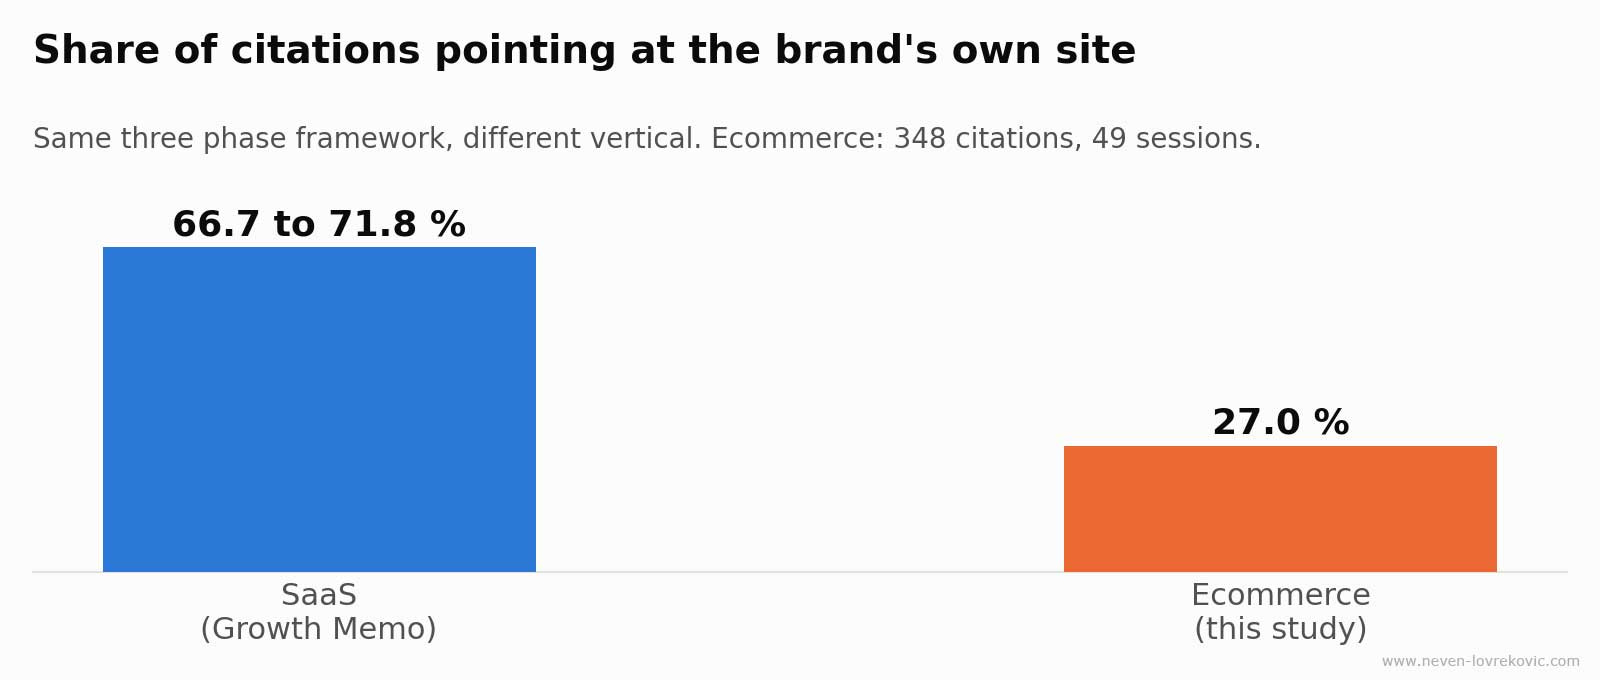
Vendor pages, meaning the software company’s own website, accounted for between 66.7 and 71.8 percent of citations.
User-generated content was around 17 percent, with Reddit responsible for most of it.
My expectation for ecommerce was that the vendor share would stay reasonably close to that level, while the UGC mix would change. I expected marketplace Q&A and YouTube to take some of the space Reddit occupies in SaaS.
Neither happened.
First thing I got wrong: brands do not own the category
Brand sites accounted for 27.0 percent of citations.
Not two thirds. Just over a quarter.
I do not think that means AI engines have some problem with ecommerce brands. The more likely explanation is structural.
In SaaS, the vendor is usually also the seller. You buy the product directly from the company that makes it, so the vendor website covers both roles.
Ecommerce often has another layer between the brand and the customer.
Retailers.
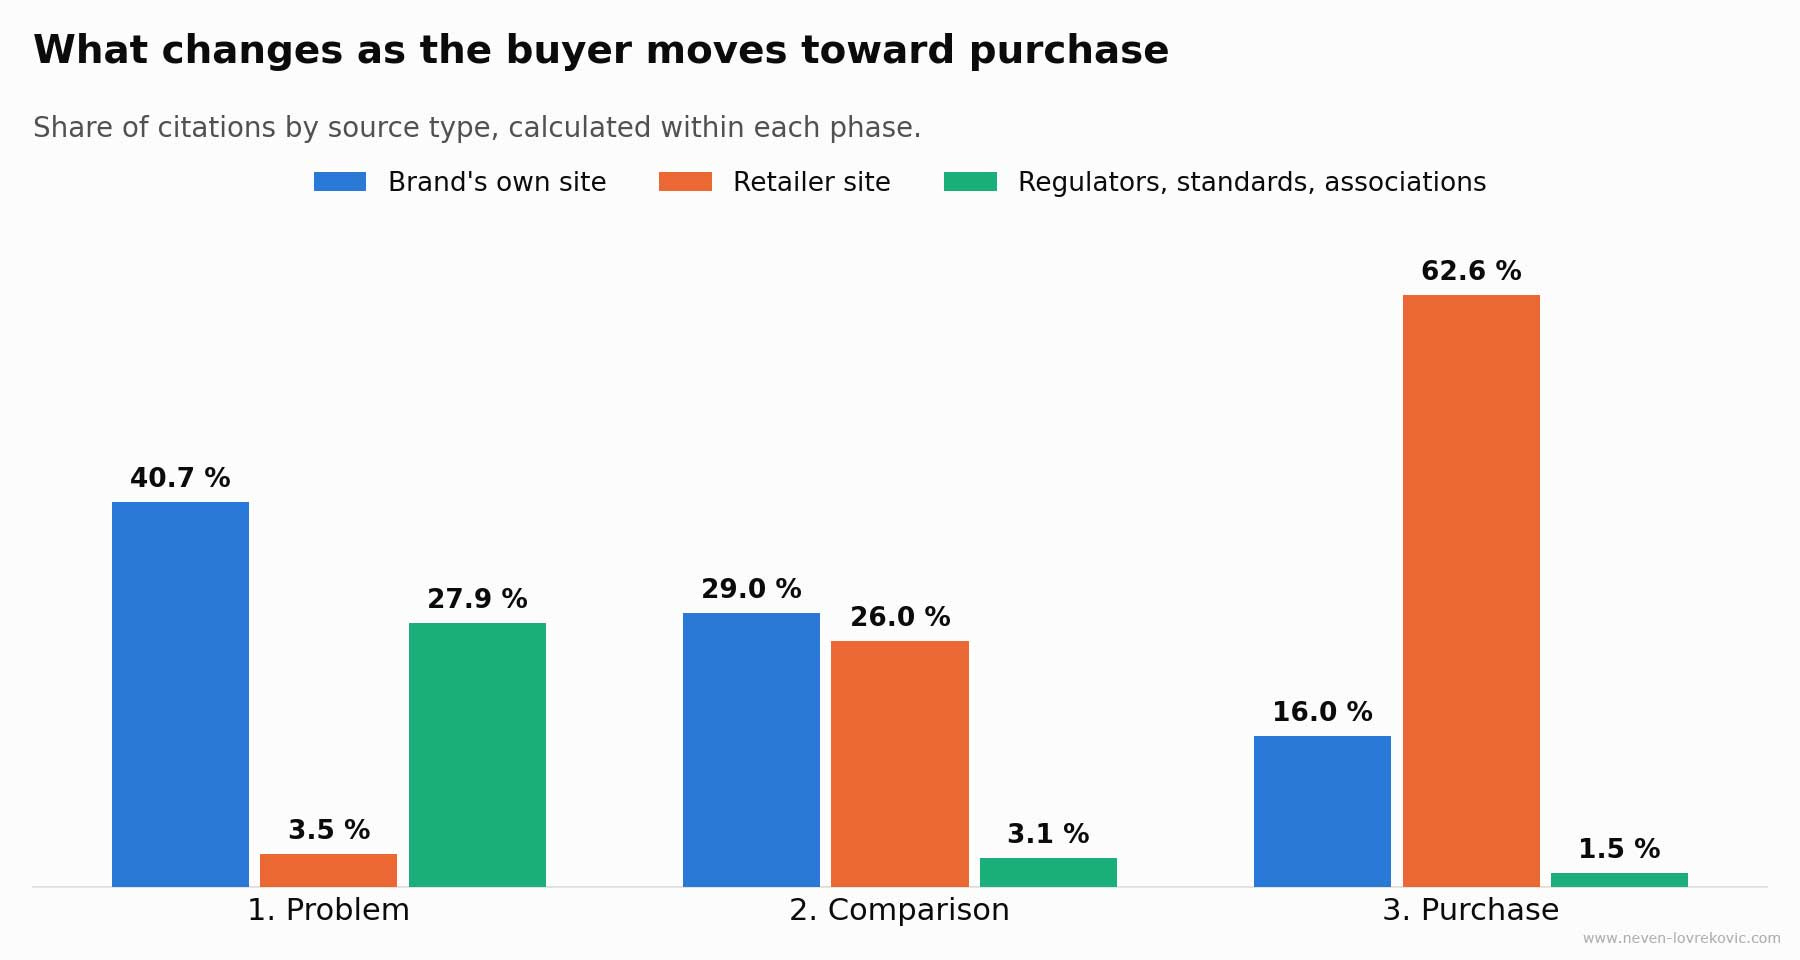
Retailer pages were actually the largest citation category in my set at 34.2 percent, ahead of brand sites.
That category does not really exist in the SaaS framework because it usually does not need to.
Even if you combine brand sites and retailer pages, you get 61.8 percent. That is still below the SaaS vendor share on its own.
The second thing I got wrong was more surprising
I expected marketplace Q&A and YouTube to absorb some of the UGC share.
Marketplace Q&A received zero citations.
YouTube and other video sources received zero citations.
Not a small share. Zero across all 348 citations.
UGC overall accounted for 5.2 percent, compared with roughly 17 percent in the SaaS benchmark. Every UGC citation in my set came from forums, mostly one very large forum.
There is an obvious limitation here.
A set of 348 citations from one market cannot tell us that video is never cited in ecommerce. It can tell us that across fifteen realistic buying questions, repeated across multiple runs, it did not appear once in this sample.
That distinction matters.
If you were considering moving budget into product video because a SaaS benchmark showed a large UGC contribution, I would want stronger ecommerce evidence first.
The average hides the most useful part
The overall brand share of 27.0 percent is interesting, but once I split the prompts by buying phase, the average became much less useful.
The share changes considerably depending on how close the buyer is to purchasing.
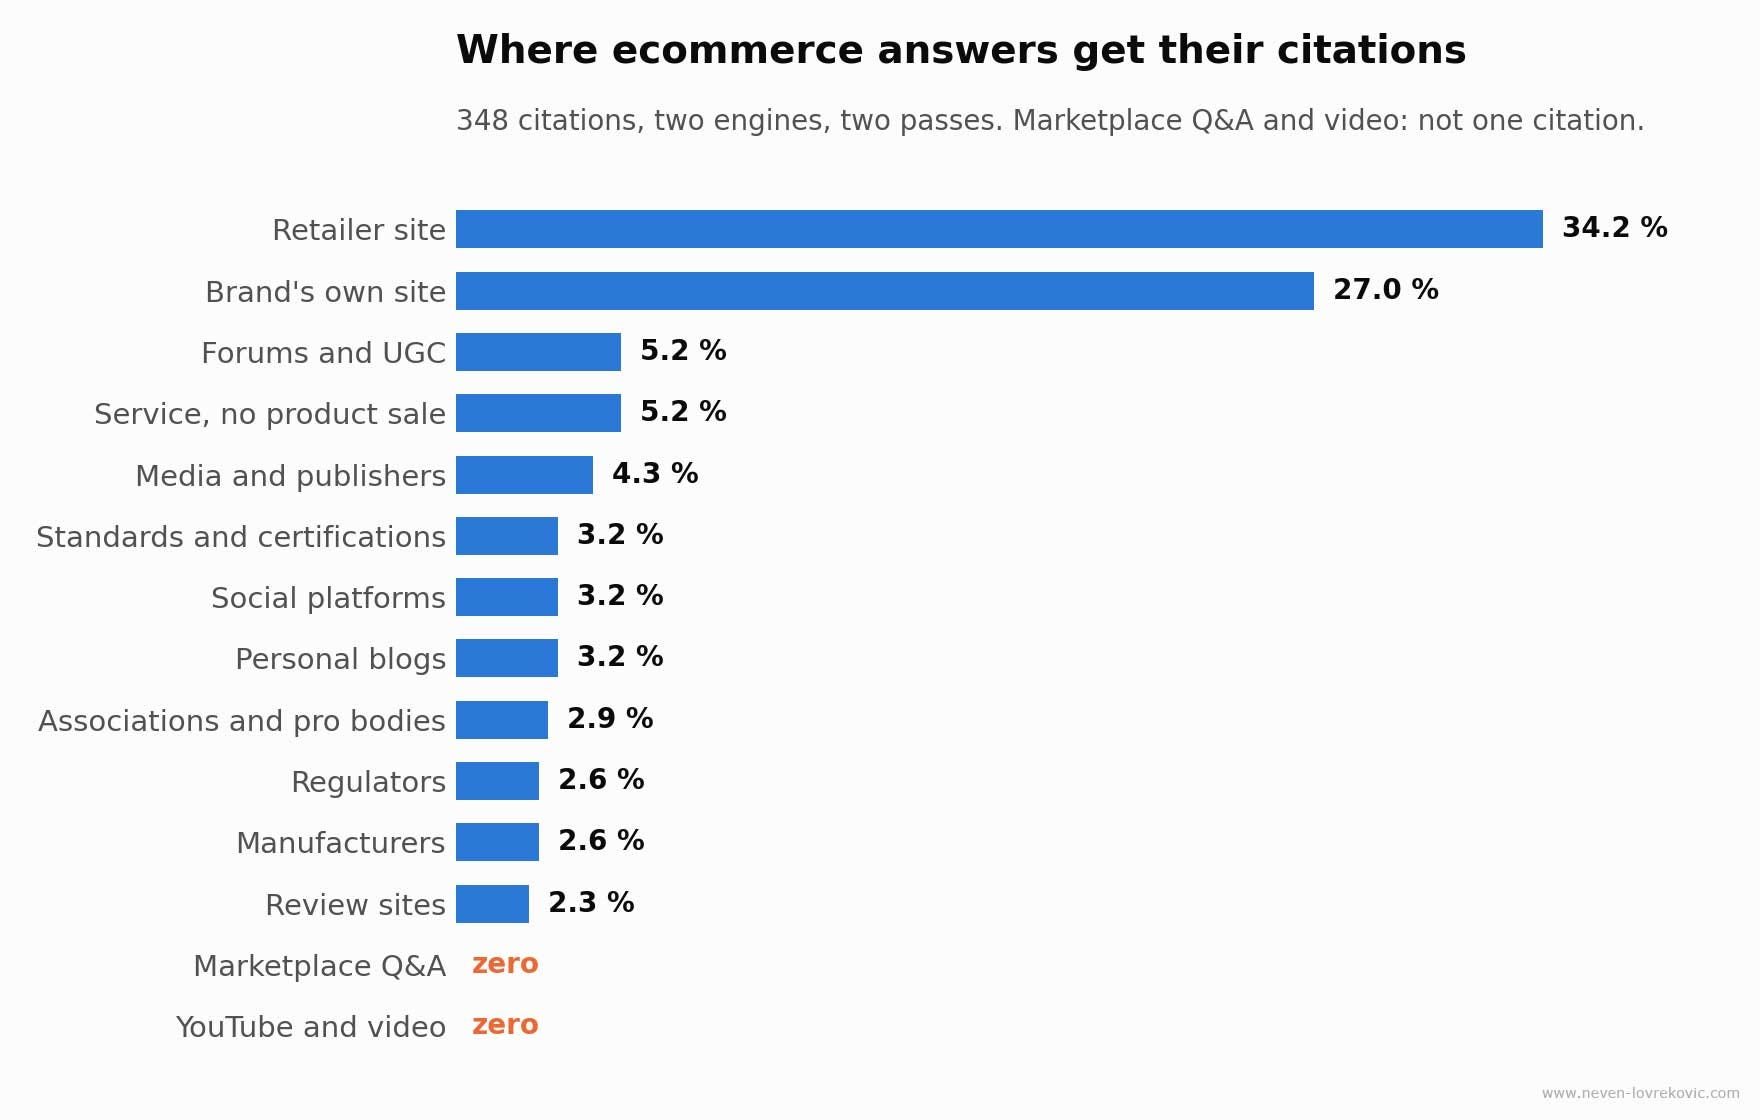
At the problem stage, with questions such as why pans keep failing or how to identify greenwashing, brand sites account for 40.7 percent of citations.
Retailers account for only 3.5 percent.
Regulators, standards bodies and professional associations account for another 27.9 percent. That is another source category that does not fit neatly into the original SaaS framework.
At the comparison stage, brand sites and retailers get much closer.
Brands account for 29.0 percent.
Retailers account for 26.0 percent.
Then the pattern flips at the purchase stage.
When the question becomes where to actually buy the product, retailers account for 62.6 percent of citations.
Brand sites fall to 16.0 percent.
Authority sources fall to just 1.5 percent.
So the closer someone gets to spending money, the more the cited answer shifts away from the brand website and towards the retailer.
For brands that sell through third parties, I think this changes how AI visibility should be looked at.
Your retailer’s product page is part of your visibility whether you control that page or not.
At the purchase stage in this sample, retailer pages were almost four times more likely to be cited than brand sites.
That makes retailer content much harder to treat as somebody else’s problem.
Another problem: the citations do not stay still
I ran every prompt twice to make the data more relevant and to see how much the cited sources changed between runs.
The goal was simple.
How much should I trust one run?
The answer was less than I expected.
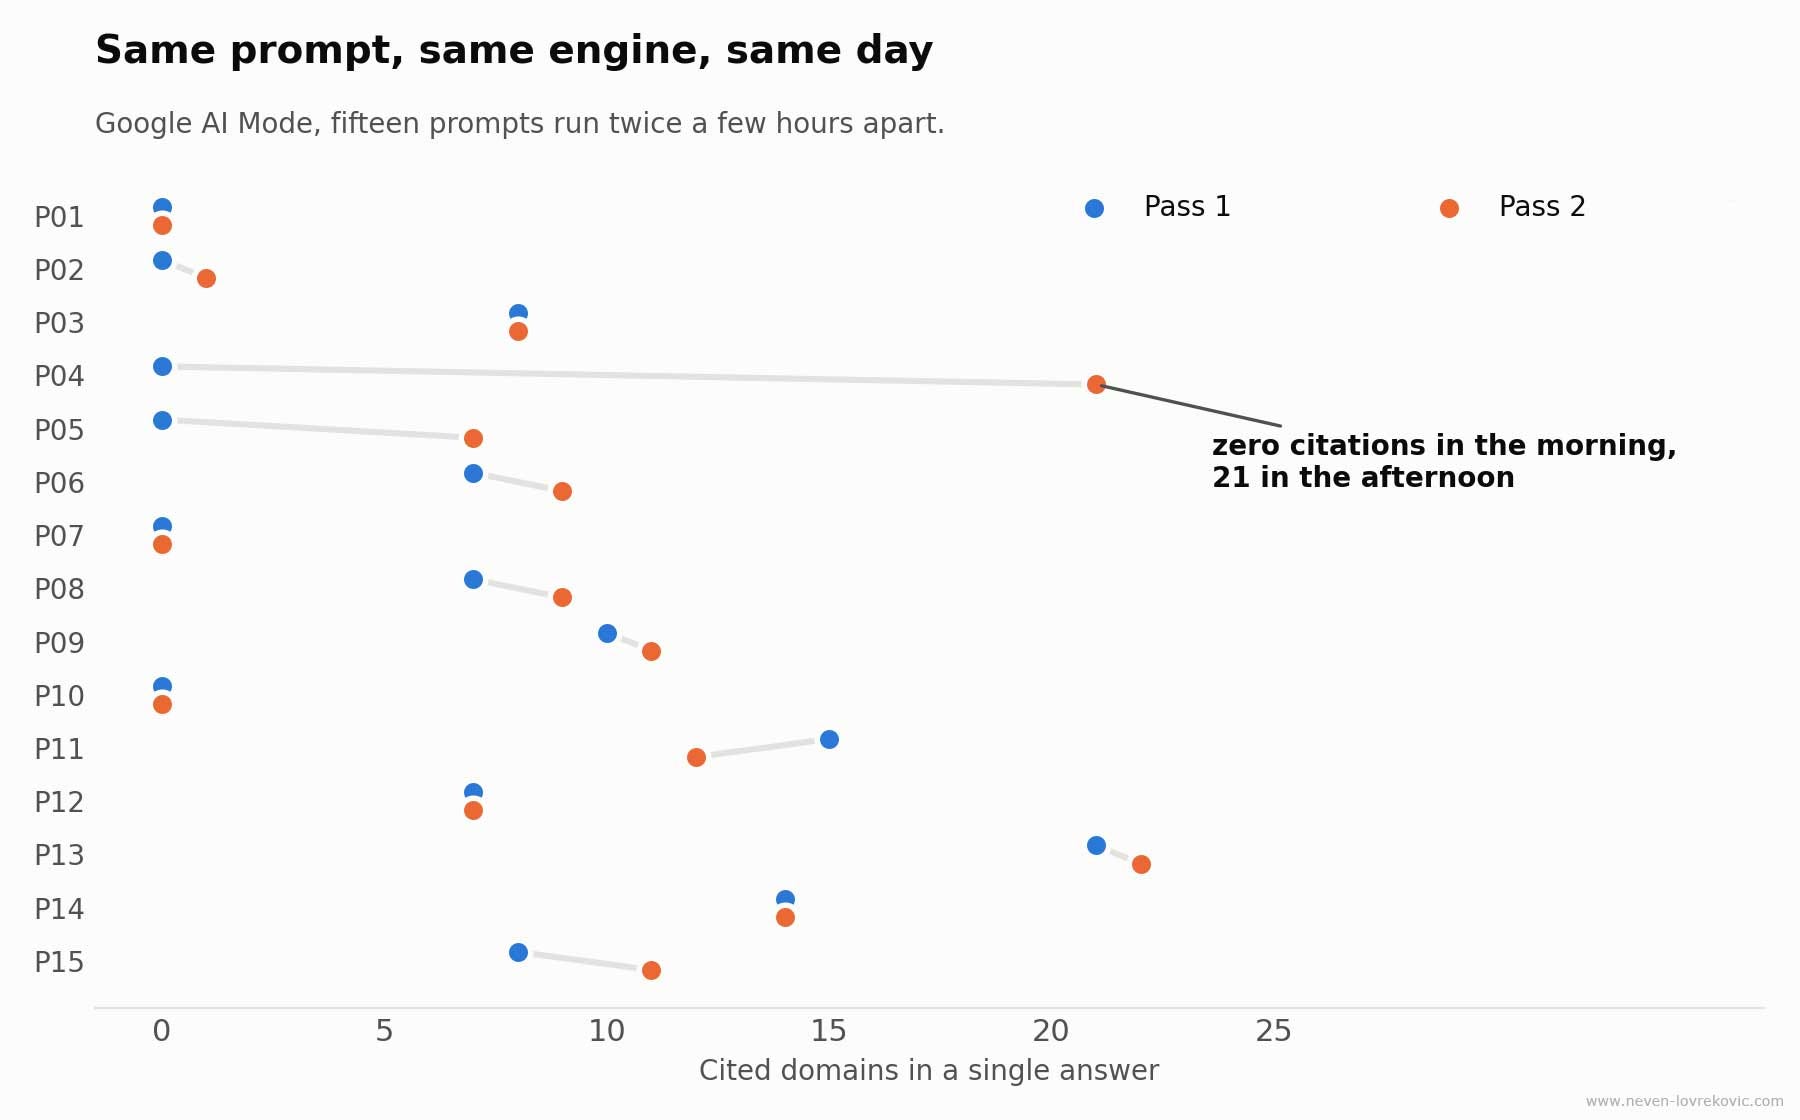
Google AI Mode retained only 32 percent of its cited sources between the two passes.
On one prompt, the first pass returned a complete answer with no citations. The second returned 21.
Another prompt went from 15 sources to 12, with a different group of sites making up the answer.
ChatGPT was more stable in the smaller repeat sample I ran there.
Across four repeated prompts, it retained 52 percent of its cited sources.
On one of those prompts it kept every source from the first pass and added another two.
This was not something I originally set out to test, but it may be the most practical result from the whole exercise.
If an AI visibility report is based on one run of one prompt, I would be very careful about treating the resulting percentage as a benchmark.
It tells you what happened in that run.
The next run can look materially different.
What I would do with this
First, repeat the measurement.
For important prompts, I would run them more than twice before making a decision from the numbers. Ideally, those measurements should also happen on different days and at different times.
Where possible, report a range rather than one precise percentage.
I would also separate prompts by buying phase.
An average that combines problem, comparison and purchase questions hides a very important change in source behaviour. Knowing that brands receive 27 percent overall is much less useful than knowing that the share moves from 40.7 percent at the problem stage to 16.0 percent at purchase.
For brands selling through retailers, I would start tracking which retailers consistently appear for purchase-stage prompts.
That gives you something concrete to work with.
Which partners are being cited?
What information appears on their product pages?
How good is the product data you provide them?
Are your strongest retail partners also the ones AI engines are surfacing?
And I would be careful about importing recommendations from another vertical.
In this sample, the two UGC channels I expected to matter most did not receive a single citation.
The same applies to authority sources.
Regulators, standards bodies and certification organisations accounted for 27.9 percent of citations during the problem stage.
If your product carries a certification, the organisation behind that certification may already be influencing AI answers around your category, even if it is nowhere near the transaction itself.
Method and limits
I used fifteen prompts across five product categories.
The prompts were written in buyer language, contained no brand names and were divided across three buying phases.
Across the test there were two primary engines, 49 sessions and 348 recorded citations from two passes.
Each cited domain was recorded separately, including its position in the answer.
A third engine was sampled but did not cover the full prompt set, so I excluded it from every percentage reported above.
There are several limitations.
This is one market.
I recorded domains rather than individual URLs.
So I would treat this as a field measurement rather than a formal study, and any individual percentage as approximate rather than universal.
Five things I would take from it
Brand sites accounted for 27.0 percent of ecommerce citations in this set, far below the 66.7 to 71.8 percent vendor share reported in the SaaS benchmark.
Retailer pages were the largest individual source category at 34.2 percent, a category that has no direct equivalent in the SaaS framework.
Brand share dropped from 40.7 percent at the problem stage to 16.0 percent at purchase, while retailers increased to 62.6 percent.
Marketplace Q&A and video produced zero citations across the 348 citations recorded in this test.
One engine retained only 32 percent of its cited sources between the two passes, which makes single-run AI visibility measurements difficult to trust on their own.
Want to know what AI sees when it looks at your store?
You can test this yourself. Take a set of problem, comparison and purchase prompts, run them more than once, and track which brands, retailers and other sources keep appearing.
But if you would rather have a second pair of eyes, send me your store. I will record a short video showing how your store appears across Google and AI search, the biggest visibility leak I can find, and the first thing I would fix.
No call. No pitch. Plain language.
Ecommerce SEO Strategist